 Should I Rent or Buy
Break-even and the price-to-rent ratio
Two quick lenses on the same question: how long until buying wins, and how expensive homes are compared with rents.
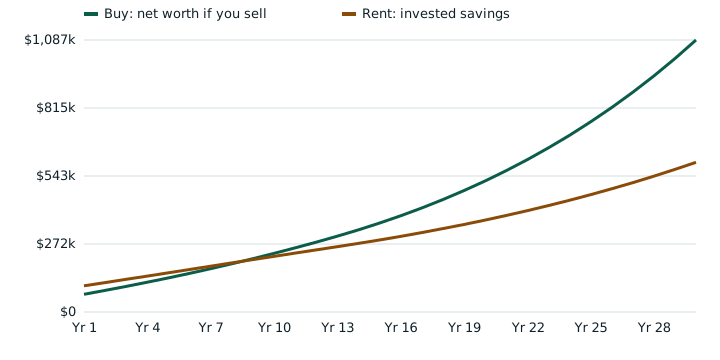
The break-even year
The calculator compares two people each year: one who bought and would sell now, and one who rented and invested the difference. The first year the buyer is ahead is the break-even year. With the example inputs it is year 9.
Price-to-rent ratio
Divide the price by twelve months of rent for a similar home. The example is $400,000 ÷ ($2,200 × 12) ≈ 15.2. It is a screening number only. It ignores rates, taxes, and how long you will stay.
What moves the break-even year
- Mortgage rate: higher rates push it later.
- Home value growth: faster growth pulls it earlier.
- Rent growth: faster rent increases pull it earlier.
- Investment return: a higher return on the renter’s savings pushes it later.
- Closing and selling costs: higher costs push it later.
Questions
What is the price-to-rent ratio?
Home price divided by a year of rent for a comparable home. A $400,000 home that would rent for $2,200 a month has a ratio of about 15. Higher ratios mean homes are expensive relative to rents, which tends to favor renting.
Is there a magic break-even number of years?
No. The break-even year depends on the rate, down payment, owner costs, rent growth, home value growth, and investment return. Rules of thumb such as five years are starting points, not answers.
If you want a person to talk through renting or buying where you live, talk to a real estate professional. The form is an inquiry only. This site does not name an agent or promise a call.